GW field course
1
How to read this book
2
Prerequisites
3
Introduction
3.1
Hydrogeology of the Seeland aquifer
3.2
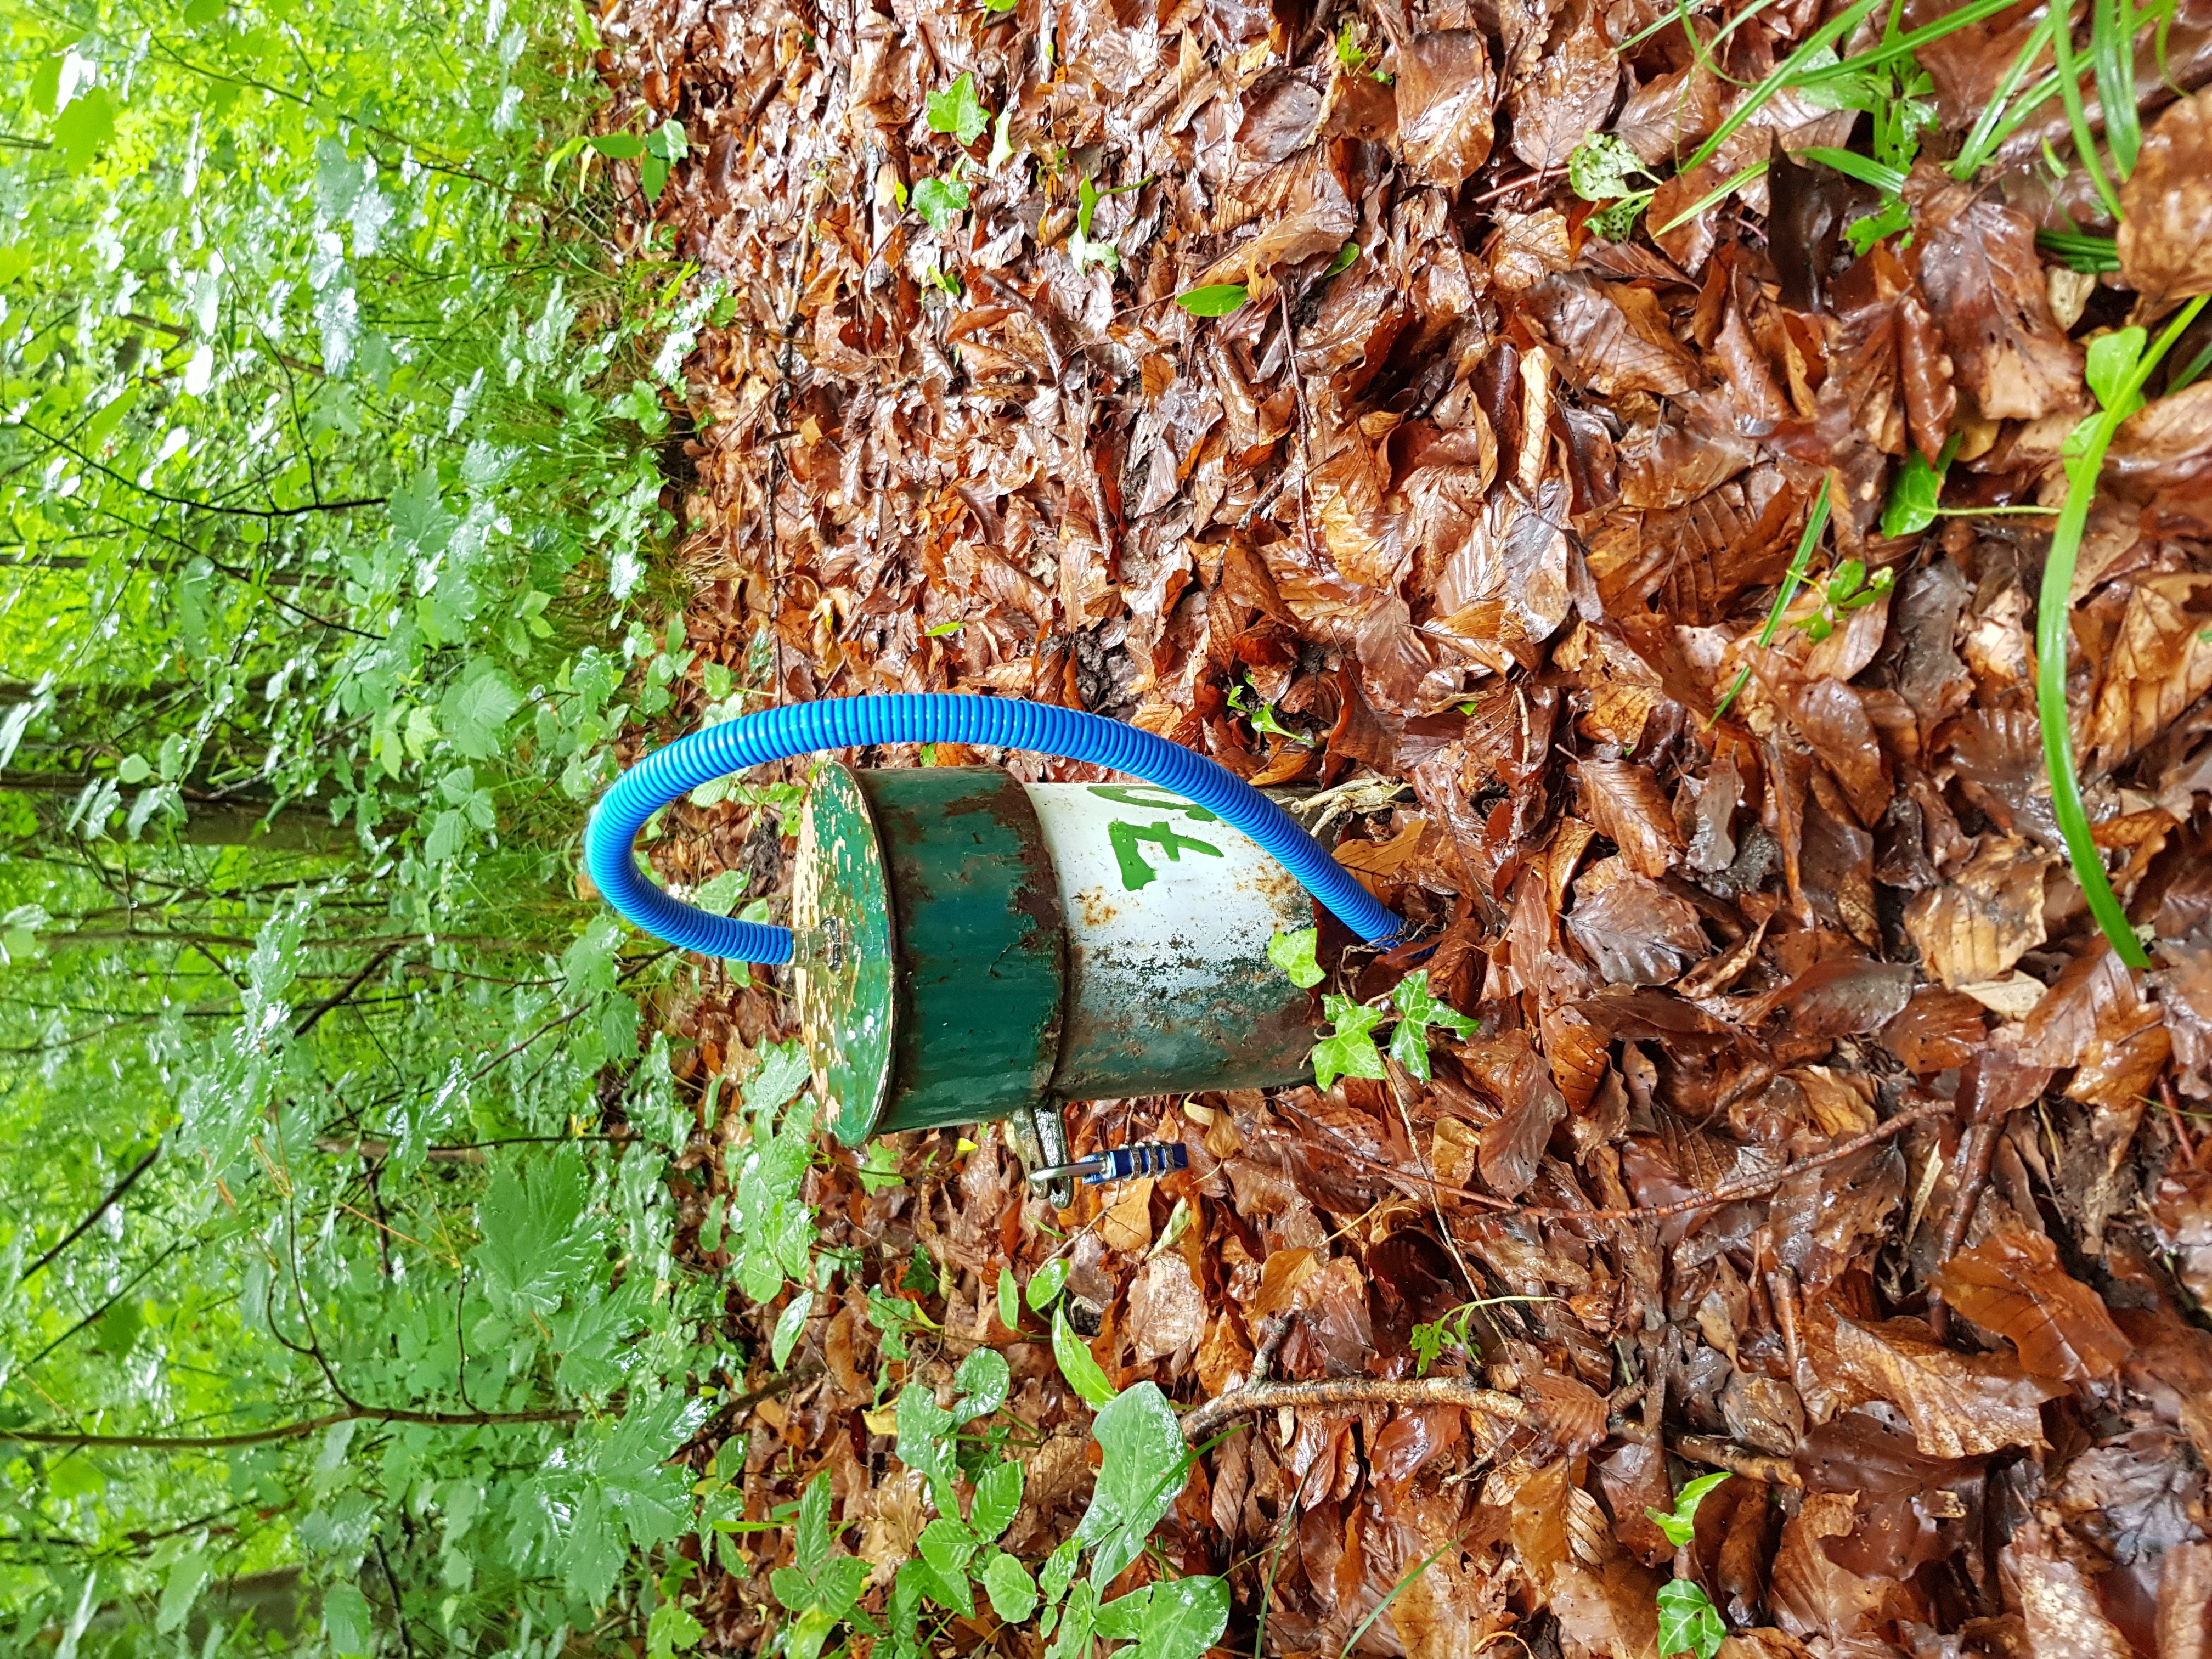
The Kappelen monitoring site
4
Groundwater levels & dynamics
4.1
The piezometric map & time series data
4.1.1
Measurement of distance to groundwater
Task 1: Estimate the accuracy of the measurement of distance to groundwater based on the data above
Task 2: Calculate the groundwater level
Task 3: Draw a piezometric map of groundwater levels in Kappelen
4.1.2
Measurement of absolute pressure
Task 4: Temperature-dependent conversion of groundwater pressure to meters of water column
4.2
Temporal evolution of groundater table
Task 5: Similarity of time series
4.3
Temporal evolution of groundwater temperature
Task 6: Discuss the temperature time series
4.4
Temporal evolution of groundwater electrical conductivity
Task 7: Electrical conductivity signals
Task 8: Conclusion
5
Measurement of aquifer properties
5.1
Flow meter test
Task 10: Evaluate flow meter test
5.2
Dilution test
Task 11: Calculate Darcy velocities
5.3
Slug test
Task 12: Estimate S and K using Cooper’s method
Task 13: Estimate S and K using Butler’s method
5.4
Pumping test
Task 14: Derive aquifer parameters
5.5
Tracer test
Task 15: Calibrate the fluorometer data
Task 16: Simulate the tracer test usind FeFlow
6
Water flow processes in the unsaturated zone
6.1
Soil water content & suction
Task 17: Derive a soil-characteristic curve
6.2
Soil infiltration capacity
Task 18: Saturated hydraulic conductivity
6.3
Aquifer recharge from precipitation
Task 19: Calculate recharge
References
Published with bookdown
Documentation for the groundwater field course
Documentation for the groundwater field course
GW field course team
2020-07-24