Chapter 6 Water flow processes in the unsaturated zone
6.1 Soil water content & suction
Soil moisture and suction head are measured continuously in the field (Figure 6.1) and in the forest (Figure 6.2).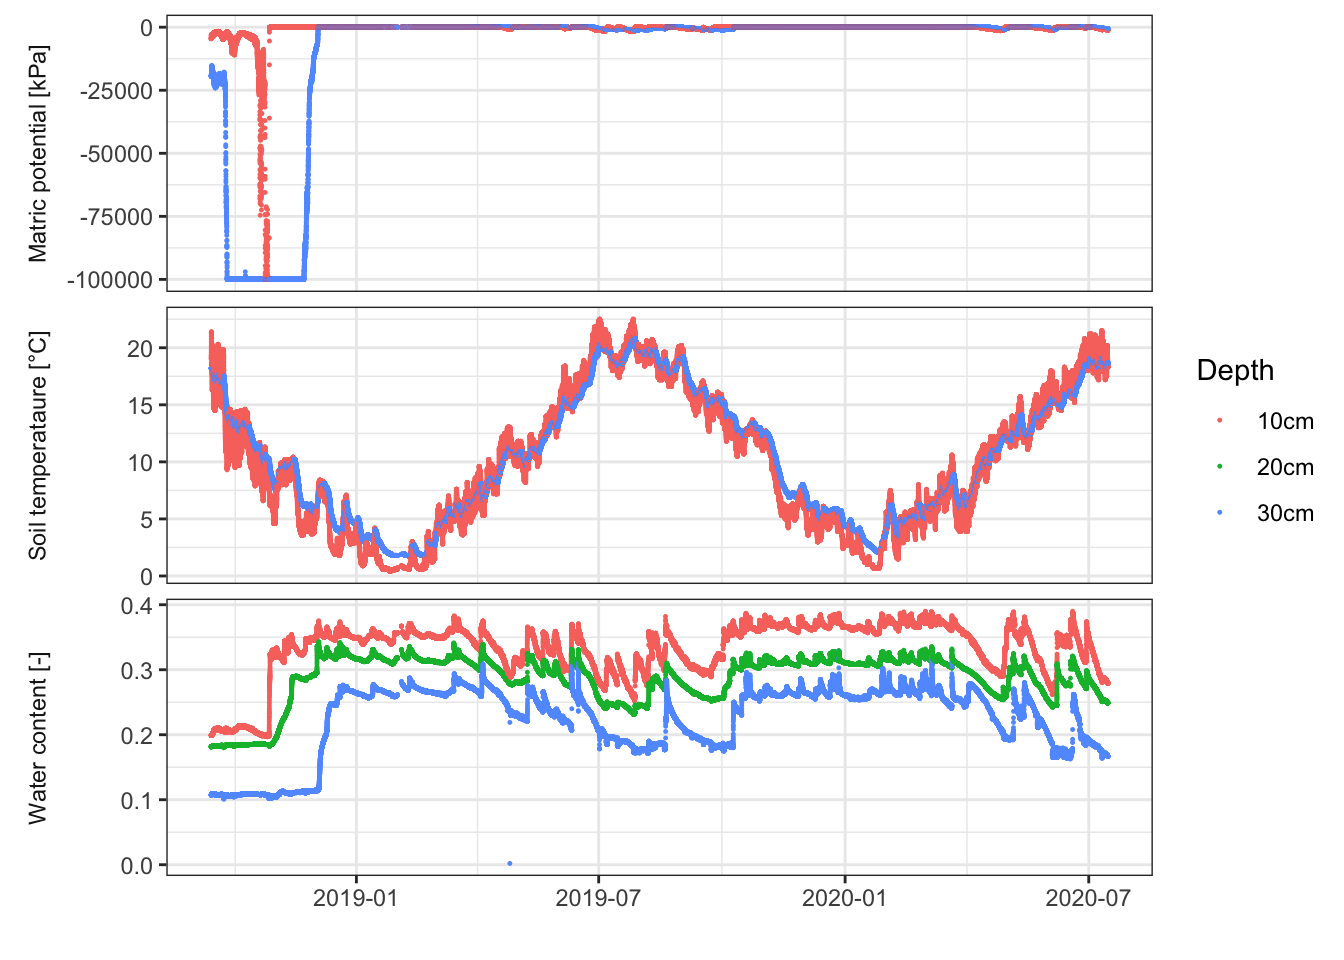
Figure 6.1: Matric potential, soil temperature and soil water content measured at 2-3 depths at the field station in Kappelen.
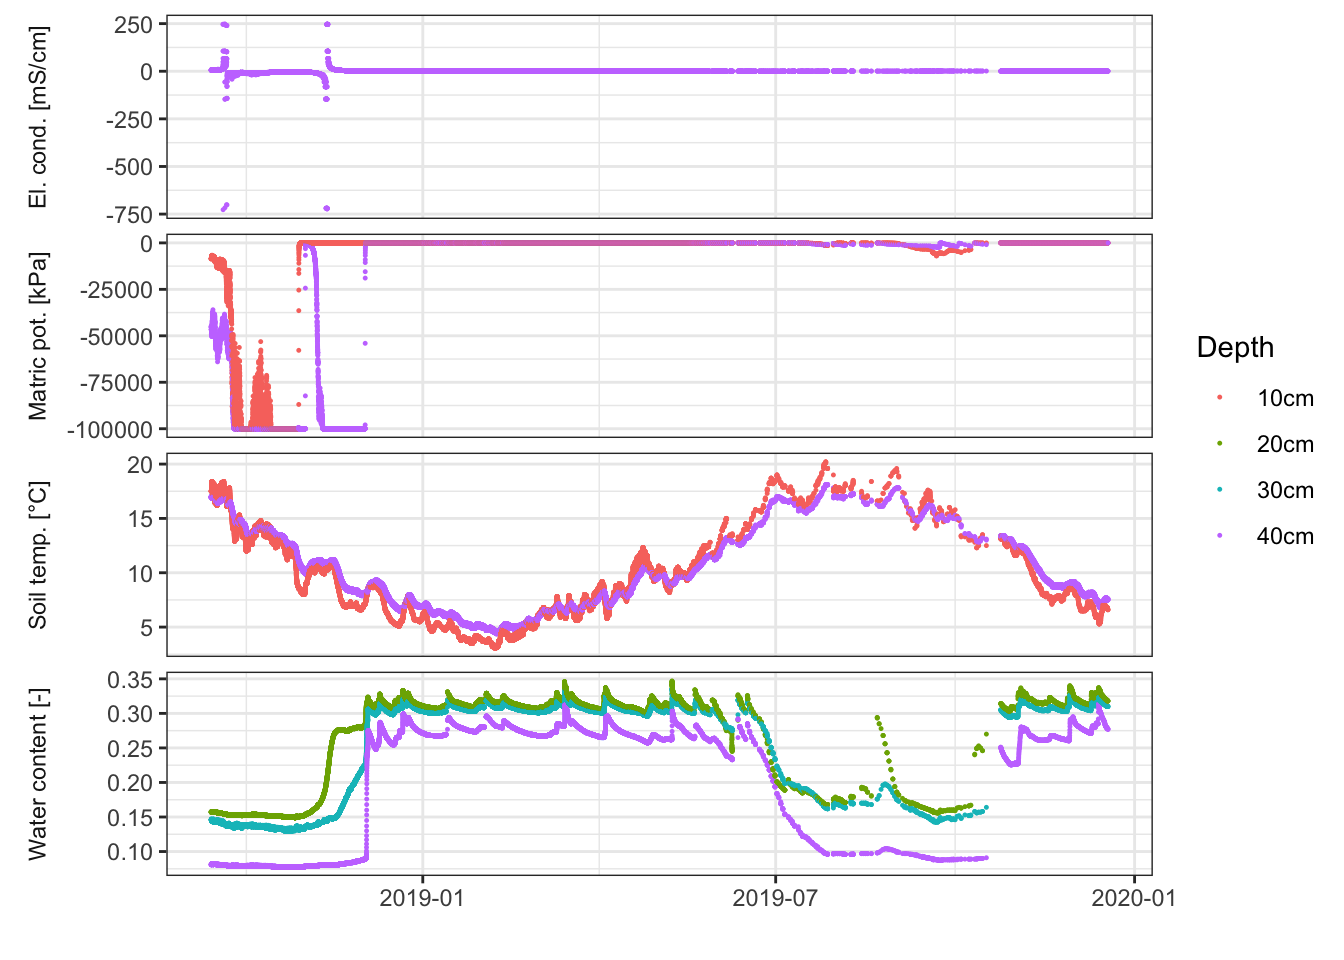
Figure 6.2: Matric potential, soil temperature and soil water content measured at 2-3 depths at the field station in Kappelen.
The sensor measuring water content at 10cm depth in the forest is not working any longer and not displayed here. If you decide to work with the raw data, do not include this sensor in your analysis. The data for the field station is available here and the data for the forest station is available here.
Task 17: Derive a soil-characteristic curve
Use the data linked above to derive soil-characteristic curves for both stations (field and forest).
6.2 Soil infiltration capacity
Double ring infiltration experiments were done on both, forest and grass soils (Figure 6.3). The data presented in Figure 6.3 is available here.
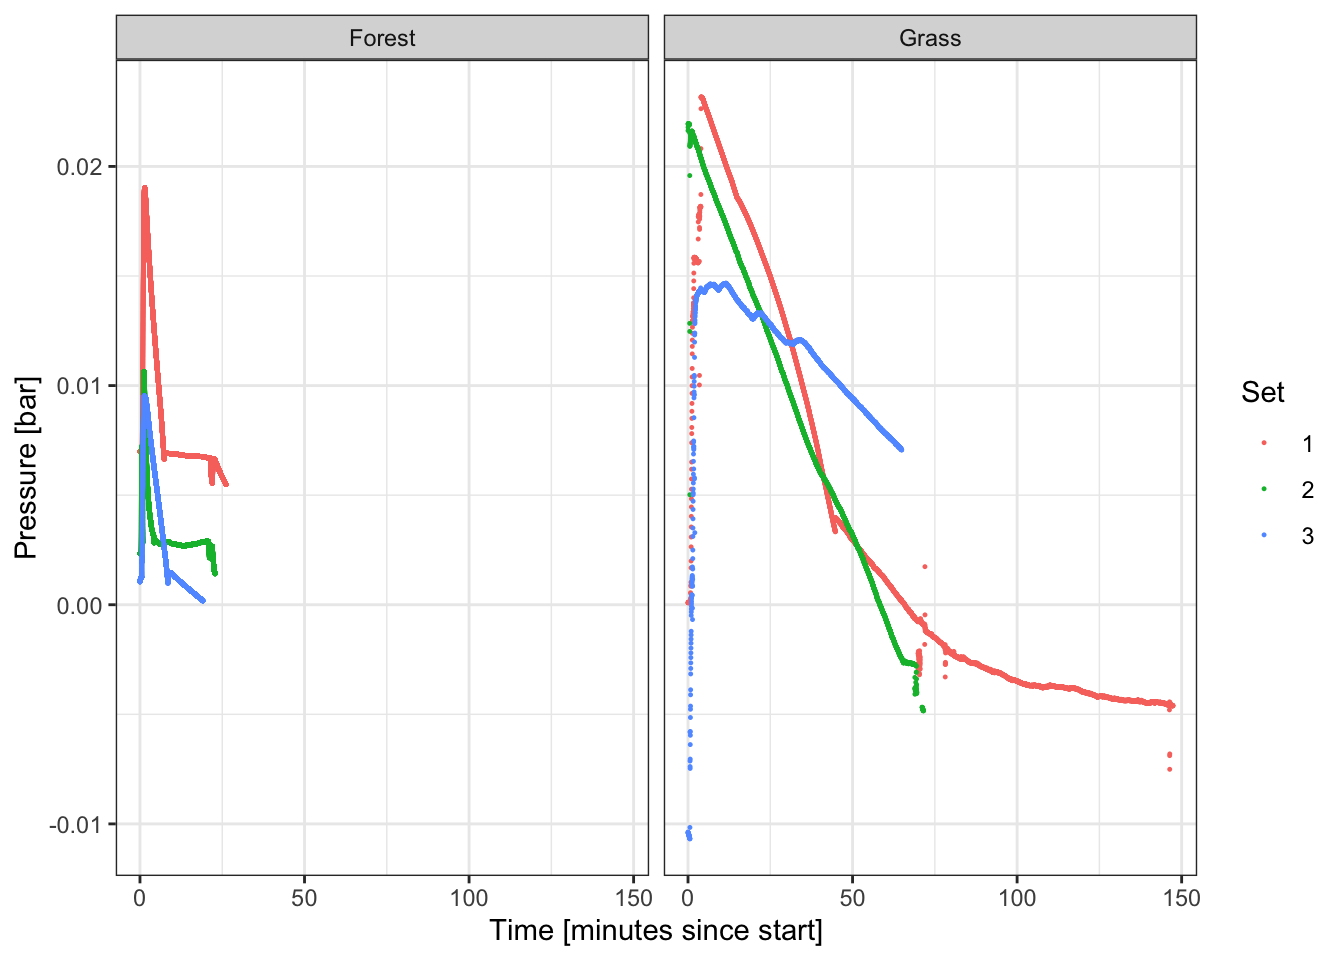
Figure 6.3: 3 data sets of soil infiltration data collected on forest and grass ground in Kappelen.
Task 18: Saturated hydraulic conductivity
Calculate the saturated hydraulic conductivity of soil under grass and forest soil.
6.3 Aquifer recharge from precipitation
The daily weather data from the station in Kappelen in given in Figure 6.4.![Daily weather data measured with the IfU weather station in Kappelen and reference evapotranspiration calculated following Penman-Montheith [@Allen1998]. ET0: reference evapotranspiration of short grass in mm, Precip: Daily sum of precipitation in mm, RH: Relative humidity in %, Rs: Daily average solar radiation in MJ/m^2^, Temp: Daily average temperature in °C. Tmin, Tmax: Daily minimum and maximum temperatures in °C, uz: Wind speed at 1.5m above ground.](GW_field_course_files/figure-html/weather-data-Kappelen-1.png)
Figure 6.4: Daily weather data measured with the IfU weather station in Kappelen and reference evapotranspiration calculated following Penman-Montheith (Allen et al. 1998). ET0: reference evapotranspiration of short grass in mm, Precip: Daily sum of precipitation in mm, RH: Relative humidity in %, Rs: Daily average solar radiation in MJ/m2, Temp: Daily average temperature in °C. Tmin, Tmax: Daily minimum and maximum temperatures in °C, uz: Wind speed at 1.5m above ground.
Task 19: Calculate recharge
Calculate groundwater recharge from precipitation using the simplified water balance model:
Recharge = Precipitation - Evaportranspiration - Runoff
Note: Assume that surface runoff can be neglected. Pre-computed daily time series of precipitation and evapotranspiration are available here.
References
Allen, Richard G., Luis S. Pereira, Dirk Raes, and Martin Smith. 1998. Crop Evapotranspiration (guidelines for computing crop water requirements). FAO Irrigation; Drainage Paper.